unit 0.3 - Tensors and real data
![]()
We will now look at some simple examples of “real” data. How do we load it and use it?
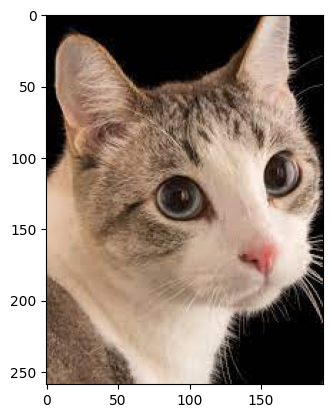
let us now load a “real” image!
[37]:
import torch
import torchvision
ima = torchvision.io.read_image("images/cat.jpg")
these are the image dimensions. What do they represent?
[38]:
print(ima.shape)
torch.Size([3, 259, 194])
We can now dipslay the image / or plot it!
[39]:
import matplotlib.pyplot as plt
iman = ima.permute(1, 2, 0) # C x H x W -> H x W x C because this is what plot image expects
# iman.shape
plt.imshow(iman)
[39]:
<matplotlib.image.AxesImage at 0x29df91e10>
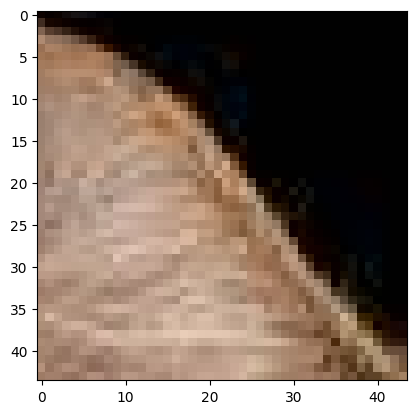
We can now manipulate this image and get parts of it (crops)
[40]:
print("image shape:", iman.shape)

# crop of image
iman_crop = iman[12:56, 23:67, :]
plt.imshow(iman_crop)
image shape: torch.Size([259, 194, 3])
[40]:
<matplotlib.image.AxesImage at 0x29e015890>
we can also get only 1 color channel now
[41]:
# 1 color
iman_crop = iman[12:56, 23:67, 1]
plt.imshow(iman_crop)
[41]:
<matplotlib.image.AxesImage at 0x29e04cbd0>

why is this multiple colors?
[42]:
plt.set_cmap('gray')
<Figure size 640x480 with 0 Axes>
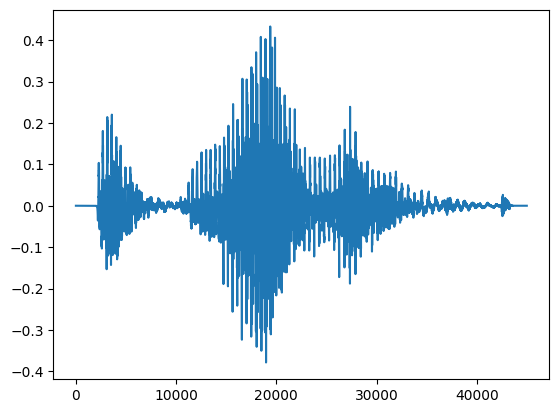
Now let us look at audio files. What are these?
[43]:
import torchaudio

data_waveform, rate_of_sample = torchaudio.load("data/my_audio_file.m4a")
print("This is the shape of the waveform: {}".format(data_waveform.size()))
print("This is the output for Sample rate of the waveform: {}".format(rate_of_sample))

# plot waveform:
plt.figure()
plt.plot(data_waveform.t().numpy())
This is the shape of the waveform: torch.Size([1, 44992])
This is the output for Sample rate of the waveform: 48000
[43]:
[<matplotlib.lines.Line2D at 0x29dede410>]
Now we can try to load typical data from a scientific survey - for example of wine data
[55]:
# this below will fail - why? Open the files and look! What data is this?
# a = torch.load("data/wine.csv")

# let's try this:
import csv
import numpy as np

with open("data/wine.csv", 'r') as f:
    wines = list(csv.reader(f, delimiter=";"))

print('wine csv loaded:')
print(wines)

wines_np = np.array(wines[1:])
print('\nwine NP loaded:')
print(wines_np)
wine csv loaded:
[['fixed acidity', 'volatile acidity', 'citric acid', 'residual sugar', 'chlorides', 'free sulfur dioxide', 'total sulfur dioxide', 'density', 'pH', 'sulphates', 'alcohol', 'quality'], ['7.4', '0.7', '0', '1.9', '0.076', '11', '34', '0.9978', '3.51', '0.56', '9.4', '5'], ['7.8', '0.88', '0', '2.6', '0.098', '25', '67', '0.9968', '3.2', '0.68', '9.8', '5']]

wine NP loaded:
[['7.4' '0.7' '0' '1.9' '0.076' '11' '34' '0.9978' '3.51' '0.56' '9.4'
  '5']
 ['7.8' '0.88' '0' '2.6' '0.098' '25' '67' '0.9968' '3.2' '0.68' '9.8'
  '5']]
Discussion: computers only understand numbers
How do we categorize?
How do we normalize? Neural networks like small numbers \([-1,1]\)